
Today we have another guest post by Paul Shepherd, this time covering integration of Ceedling and Unity with the build status reporting.
Paul is the Lead Electrical Engineer at Benchmark Space Systems. He has spent time in the Aerospace, Consumer Audio, and Integrated Circuits fields, more often than not working at the intersection of hardware and software. You can contact him via LinkedIn.
In the last post, we shared a method for implementing custom build steps in the Eclipse IDE. We used this method at Benchmark Space Systems to add a firmware version to our project.
Unit testing is another best practice that we have embraced, and we are working to cover as much of our embedded code as possible. We chose Ceedling+Unity for our unit testing framework, in part because of its strong integration with the Eclipse IDE. Ceedling works well on our developer workstations in Eclipse and command prompts, and it was also straight forward to get running on our build server (Jenkins running on Ubuntu). This post focuses on the less straightforward step of capturing the unit testing results and reporting them to Jenkins.
If you are new to Ceedling (or even unit testing in general, like I am) I recommend Matt Chernosky’s eBook A Field Manual for Ceedling. His field manual enabled us to quickly understand and start using these testing tools. I’m also reading James Grenning’s book Test Driven Development for Embedded C.
Ceedling is still pre-1.0 as of February 2019. While it is quite capable, there are some areas lacking documentation, which required us to tinker under the hood to complete our integration.
An important caveat: this blog post reflects Ceedling 0.28.3, released on 8th August, 2018. A PR has been submitted to add coverage reporting via xml output, but this blog shows how to hack the 0.28.3 branch to get this working. The blog post will be updated when that PR has been merged to master.
The content in this blog post was developed based on the following software versions:
- Ceedling: 0.28.3
- CException: 1.3.1.18
- CMock: 2.4.6.217
- Unity: 2.4.3.122
Running and Exporting Test Results from Ceedling
The documentation and how-to articles available for Ceedling do an excellent job of getting you to the point of running tests. There are a few additional steps needed to collect and post results during the Jenkins pipeline build process.
First, the Jenkinsfile was updated to run the test as a new build stage:
stage('Unit testing')
{
steps
{
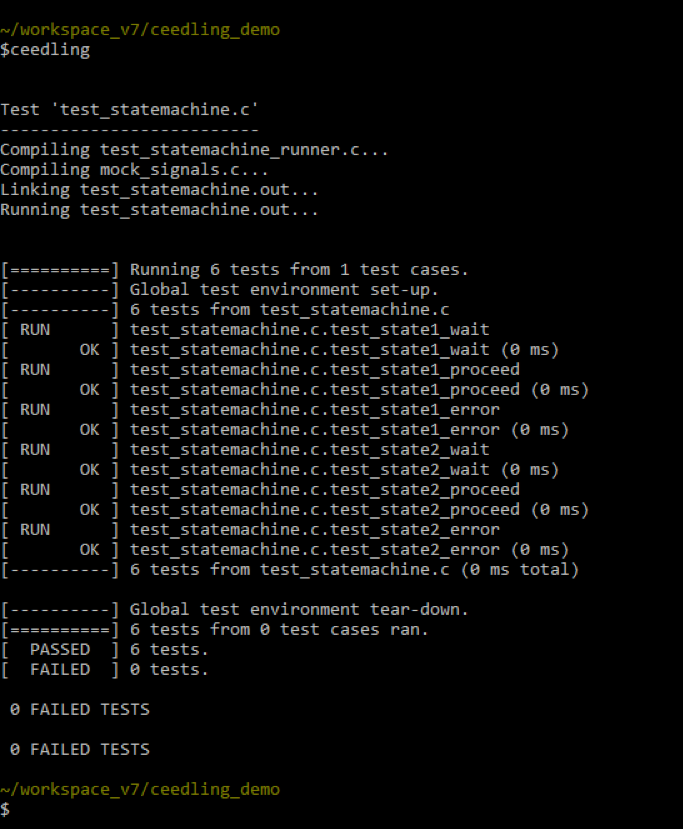
sh 'ceedling’
}
}Running this shell command is sufficient to report overall unit testing status because Ceedling returns an exit code based on the test results. However, if a test fails, you must manually hunt through the build log to determine the cause. Jenkins has a nice interface for reporting test results and highlighting test failures, but an XML with the test result data must be captured during the build process.
In order to post the Ceedling test results in XML format, a new line must be added into the Ceedling’s project-specific configuration file, project.yml:
:plugins:
  :enabled:
    - xml_tests_report # <--- this line has been added
    - stdout_gtestlike_tests_report
Once the xml_test_reports argument is added to the plugins section of the configuration file, a report.xml file will be generated in the ($BUILD_DIR)/artifacts/test/ directory.
In order to parse the test results, you will need to install the xUnit plugin. A custom XML formatting style sheet is also required. We use the Jenkins-unity-xml-formatter.
The unity.xsl file can be placed anywhere in the project directory tree. The xUnit command in the Jenkinsfile must reference this file relative to the project root directory ($(PROJECT_DIR)).
We then add a post step in the Unit Testing Pipeline stage to capture these results:
stage('Unit testing')
{
     steps
     {
          sh 'ceedling’
     }
     post
     {
          always
          {
                xunit tools: [Custom(customXSL: 'unity.xsl', pattern: 'build/artifacts/gcov/report.xml', skipNoTestFiles: false, stopProcessingIfError: true)]
          }
     }
}
Generating a Code Coverage Report
Several steps are necessary to generate and post the test coverage data. The gcov plugin must be enabled in the project.yml file to generate code coverage data:
:plugins:
  :enabled:
    - gcov # <--- this line has been added
    - xml_test_reports
    - stdout_gtestlike_tests_report
Once the gcov plugin has been enabled, it can be called at the command line by appending gcov:all to the ceedling command.
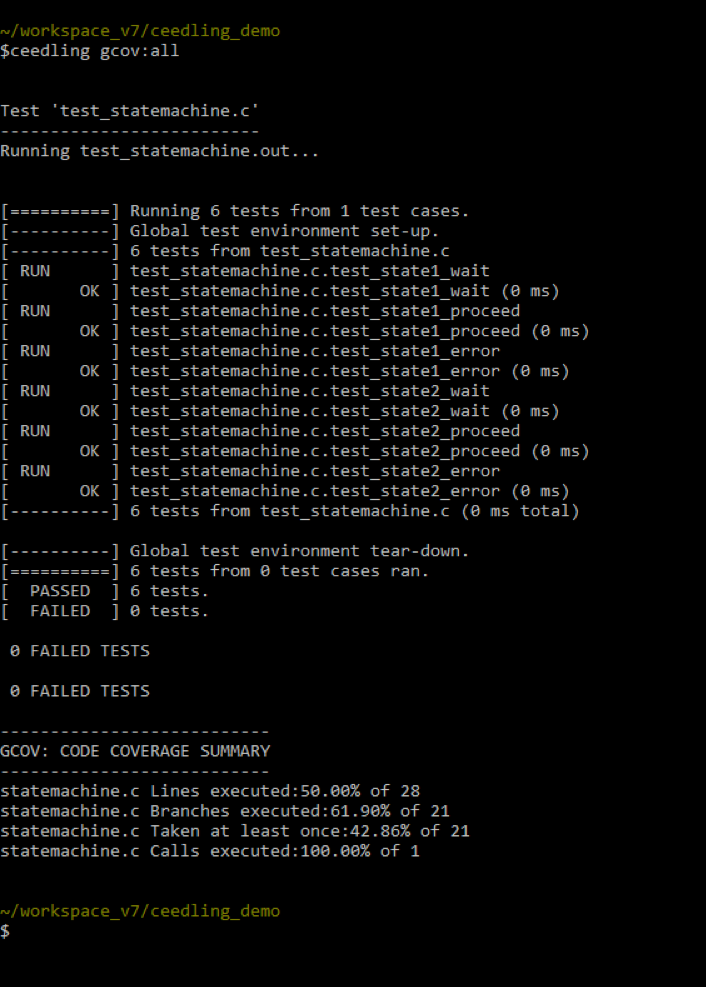
Unfortunately, this doesn’t actually generate the test report file. Ceedling implements the gcov functionality internally, but to create a report from this data, the Gcvor tool must be installed.
Once gcovr is installed, we add another line specifying the reporting type to the project.yml file:
:gcov:
 :html_report_type:  detailed
Note that the :gcov: section should be defined at the top level. It is not a subsection of anything else in the project.yml file.
Now that gcov and reporting are enabled in the project.yml file, we can generate a coverage report by adding an additional parameter to the Ceedling command line invocation.
ceedling gcov:all utils:gcovAlthough this looks a bit repetitive, both parameters are necessary: gcov:all runs the test coverage analysis, and utils:gcov calls Gcovr to generate a report in HTML format.
Ceedling’s gcov plugin will only generate an html report unless we hack the internal plugin configuration. In order to use Gcovr to generate a Cobertura-style xml report, two files must be edited.
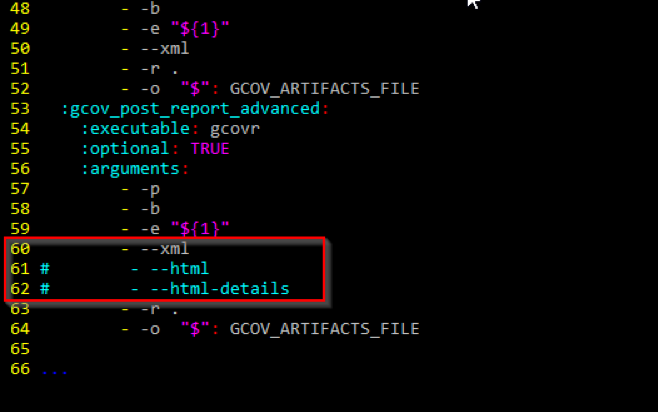
To add XML report generation, open the file ($PROJECT_DIR)/vendor/ceedling/plugins/gcov/config/defaults.yml. In the gcov_post_report_advanced section, the --xml argument must be added to the gcovr command, and the --html and --html-reports arguments must be removed.
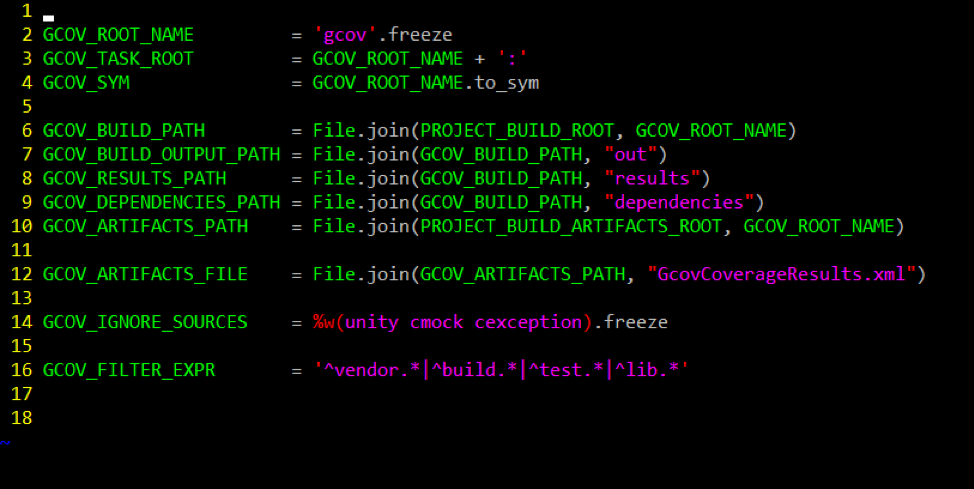
Next, open file the file ($PROJECT_DIR)/vendor/ceedling/plugins/gcov/lib/gcov_constants.rb. Update the GCOV_ARTIFACTS_FILE variable to have a file extension of .xml instead of .html.
These edits are superseded by a Pull Request in the Ceedling repo, but will be necessary until the PR is merged into master.
Parsing the code coverage report
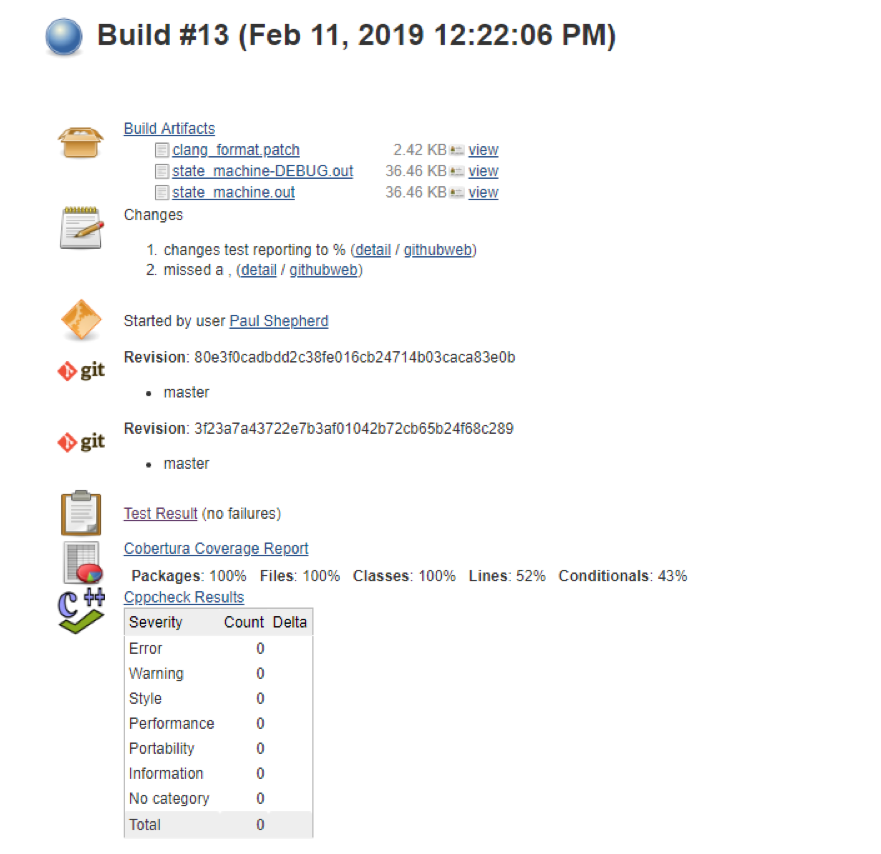
Gcovr outputs a Cobertura-compliant xml report which Jenkins can parse with the Cobertura plugin.
Our unit testing pipeline step is updated to use the new Ceedling invocation and to capture the code coverage results:
stage('Unit testing')
{
  steps
  {
    sh 'ceedling gcov:all utils:gcov'
  }
  post
  {
    always
    {
        xunit tools: [Custom(customXSL: 'unity.xsl', pattern: 'build/artifacts/gcov/report.xml', skipNoTestFiles: false, stopProcessingIfError: true)]

        cobertura coberturaReportFile: 'build/artifacts/gcov/GcovCoverageResults.xml'
    }
  }
}
There are many arguments that you can add to your xUnit and Cobertura pipeline steps in order to set healthy/unhealthy boundaries. Cobertura naturally uses % of total for its metrics, but for xUnit, you must specify ‘thresholdMode:2’ in order for the tool to work in % of tests instead of absolute numbers. For unit testing, I feel that relative measures, rather than absolute measures, are a much better view of the overall health of your codebase.
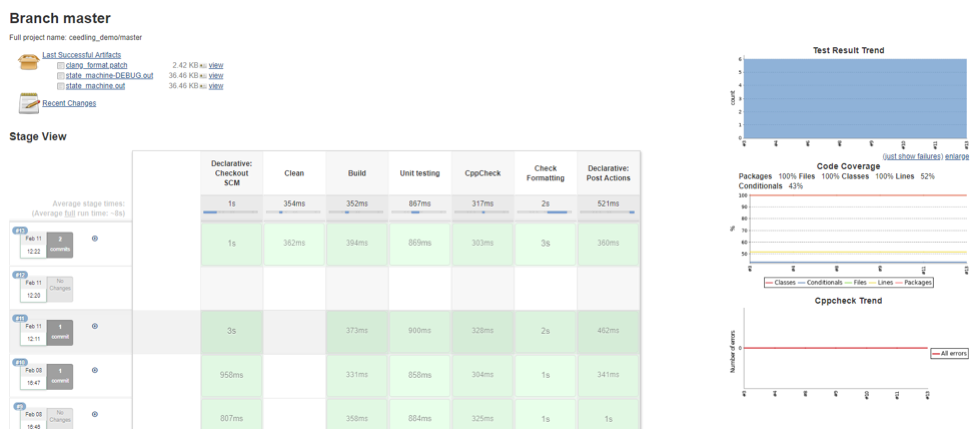
Our experience has been that bringing these metrics to our build status page keeps us motivated and simplifies communicating our work status to our stakeholders. I hope that the information we shared here is useful to you in improving your own continuous integration process. I’d also like to thank the team at Embedded Artistry for allowing me to share these tips on their blog.
Further Reading
- Using Custom Build Steps with Eclipse Auto-generated Makefiles
- Embedded Systems Testing Resources
- A Field Manual for Ceedling
- Test Driven Development for Embedded C
- What I Learned From James Grenning’s Remote TDD Course
- Ceedling
- Unity
- Benchmark Space Systems
- Giving Your Firmware Build a Version
- Jenkins Pipeline Library
- Jenkins xUnit Plugin
- Jenkins-unity-xml-formatter
- Gcovr installation
- Jenkins Cobertura Plugin
There is a typo in the above plugin name: xml_test_reports should be xml_tests_report
Thank you – I’ve corrected the article!
May I ask a very stupid question: if I try to execute ceedling I only get an overview with number of tests passed. How do you create the output above with each test shown in a single line?
try
ceedling verbosity[4] testtry ceedling verbosity[4] test