
There are certain skills that mark you as being a grizzled, battle-hardened embedded systems veteran. One that stands out is being able to debug a processor hard fault with ease. Even more so if you know how to build the infrastructure to support such debugging efforts.
I remember the first time I encountered a processor fault in a program. I made some changes, flashed the hardware, and expected to see a familiar pattern of blinking LEDs. Instead, there was no blinking: the device was hung. I wired up the debugger and just stared blankly while it told me the program was stuck in a HardFault_Handler ISR, not sure what to do next.
I know I’m not alone here, because we often hear from prospective clients who are brought to a standstill by a hard fault in their system. For example, this is a recent help request we came across in a consultants’ forum:
We are currently encountering a problem with our FreeRTOS-based devices when testing in our environmental chamber. Devices stop responding when the chamber temperature drops to -40 C. We added some debug code and we believe the device is rebooting because it experiences some form of Hard Fault. I am trying to help investigate what could possibly be happening but I really don’t know anything about FreeRTOS.
If you think you might have any knowledge of debugging hard faults or if you know anyone that might be interested in consulting, would you please let me know?
The overall situation is certainly much better than it used to be, since you can find wonderful guides for debugging processor faults. When I was initially debugging faults, however, there was much less information on the Internet, especially for niche subjects like embedded software development. You had to actually talk to a more experienced colleague, read the processor’s reference manual, read the relevant processor architecture specification, and experiment.
Below, I shall describe the evolution of my fault debugging strategies over the years. I’m sure that the experienced embedded developers in the audience will draw parallels to their own careers. However, my goal is for newer developers to skip this long and painful road. I hope to help you find better fault debugging solutions that you can rely on throughout your careers. There is no need to recreate the pain that I went through over the past decade, although I do recognize as embedded developers, we seem to pride ourselves on doing things The Hard Way.
Table of Contents:
- What Causes a Processor Fault?
- The Default Implementation of a Fault Handler
- Manual Debugging
- Tool Support
- Limitations of Manual Debugging
- How the Pros Do It
- Finding a Solution
- Further Reading
What Causes a Processor Fault?
Processor faults are triggered by attempts to do “illegal” things, such as writing to memory that is off-limits or invalid, attempting to execute invalid instructions, dividing by zero, or using a disabled coprocessor.
Each processor architecture has a slightly different approach and naming scheme for processor faults. I am using ARM terminology in this article, and particularly for the Cortex-M. The general techniques apply to other processors as well, although the exact set of registers, fault types, and fault conditions may differ. For example, Cortex-A processors have a Data Fault Status Register (DFSR) and an Instruction Fault Status Register (IFSR), neither of which are present on Cortex-M.
On the Cortex-M, faults fall into four major categories, each triggered by different causes:
- Bus Fault – triggered by memory access errors
- Memory Management Fault – triggered by memory access violations for regions restricted by the MPU or MMU
- Usage Fault – triggered by a wide range of conditions, some of which are configurable. Examples include executing undefined instructions and divide-by-zero.
- Hard Fault – triggered by a Bus Fault, Memory Management Fault, or Usage Fault when their handlers are not executed, or when a fault occurs while handling another fault.
When a fault occurs, the objective is to figure out the exact cause of the fault and correct it. Easier said than done.
The Default Implementation of a Fault Handler
Most processor vendor SDKs (likely copying the CMSIS template) will implement the Bus Fault, Usage Fault, Memory Management Fault, and Hard Fault handlers as simple while(1) loops. These functions are defined as “weak” symbols, meaning that we can re-define the functions in our own program, causing the compiler to use our version instead of the “weak” version. The nominal purpose of this while(1) implementation is to keep the system in its failed state so that you have the opportunity to connect a debugger and investigate.
You can see two examples of this using extremely popular processor vendor SDKs: STM32Cube (here’s the handler implementation), and Nordic’s nrfx.
Note: To be fair to Nordic, advanced exception handling is provided with the nRF Connect SDK, which uses the Zephyr ecosystem. These projects have a much more sophisticated approach to handling faults, similar to what is described later in this article.
Manual Debugging
On the surface, a while(1) handler makes sense. Our program will hang in a state that gives us time to attach a debugger and analyze the processor register and memory states. However, if you’ve never encountered a fault scenario before, you will probably react the way I did: staring blankly at your debugger wondering what to do next.
If you are an experienced fault debugger, you will typically work through the following steps, although the order will vary by the individual and situation.
Note: For a detailed explanation of manually debugging faults, see this excellent article.

Of course, this process presupposes that the developer who just encountered a hard fault actually has a deep understanding of the processor!
- You have to know that the CFSR register exists
- You have to know how to find the processor’s reference manual, as well as where to look, so that you can:
- You need to know what data is stored on the stack when there is a context switch
- You need to know that there are two stacks on a Cortex-M and know how to determine which is active
- You have to know that by default, the Cortex-M Bus Fault, Usage Fault, and Memory Management Fault interrupts are disabled and must be enabled by software
- This default behavior causes all fault conditions to trigger a hard fault, which may be misleading to a beginner
- You need to know where and how the RTOS stores thread information so that you can access it
- You need to understand how to get this information out of your debugger
- You may need to disassemble your program and work instruction-by-instruction to pinpoint the cause of the fault
The debugging exercise also sounds easy in theory, but it is not so fun in practice. For example, when you’re looking through processor manuals, you will see nice names (like CFSR) and images like this:

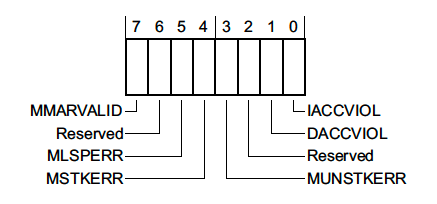
Great, so we know how to decode the CFSR register and the BFSR field! How can we get that value in a program?
p/x CFSR
No symbol "CFSR" in current context.
Of course, CMSIS makes this easier for us by providing register mappings. However, in many contexts, we still can’t say:
p/x SCB->CFSR
No symbol "SCB" in current context.
Instead we need to find the raw register address and print the contents out:
p/x *(uint32_t*)0xE000ED28
$3 = 0x1
Uh… what does that bit mean? Now we get to go back to our initial reference diagrams and interpret the data.
Note: That value indicates a memory management fault triggered by an invalid instruction.
I enjoyed going through this manual process exactly once. After that, it becomes extremely tedious and error-prone, especially during long and difficult debugging sessions.
Tool Support
Typically, the next step in the progression is to find tools that can simplify the debugging process.
Projects like PyCortexMDebug provide GDB python scripts that simplify the process of inspecting registers, allowing us to access registers by name and print human-readable output for each field in the register.
We can also rely on dedicated debugging programs like Segger’s Ozone to aid in fault debugging. Whenever a fault is detected, Ozone will automatically collect and interpret relevant fault information for us and present it in a pop-up. Tools like this can really short-cut the learning curve for debugging faults.
Note: Some IDEs may provide similar support, but I am not experienced with debugging inside of an IDE.
Limitations of Manual Debugging
Taking a manual approach to debugging faults is a fine first step. As a professional, however, four major concerns come to mind when relying on a manual fault debugging process.
- Using
while(1)in production - Catching issues in the field
- Debugging issues remotely
- Required expertise
Concern 1: while(1) in Production Software
On the surface, having a while(1) to hang our program in the fault handler seems useful since it gives you a chance to connect a debugger and analyze the failure. However, a while(1) loop is undesirable in the field. This will cause your device to hang until the battery dies or the customer manually resets the device (if that’s even possible).
At the very least, we need to override the implementation with logic that will cause the device to reset if a fault is encountered. Of course, your production software should also have a watchdog timer enabled, which would also reset the device if the program hangs in a default fault handler. However, a better default fault handler implementation would check if a debugger is currently connected, triggering a breakpoint if it is and automatically resetting the device if it isn’t.
I have worked on many programs that did not take any of these preventative measures. Since SDKs allow developers to abstract themselves from the hardware to a degree, developers without processor bring-up or fault debugging experience may not even be aware that this a situation that needs to be avoided.
Note: Some system designs may necessitate attempting to recover from a fault rather than simply restarting the entire system. In this case, neither a
while(1)loop nor an automatic reboot is desired.
Concern 2: Catching Issues in the Field
It is an ironclad law of embedded product development that the device never functions in the field the way it does in your office or lab. The development team testing the product exactly the way the it is designed to work and under ideal environmental conditions. Network access is good, the power supplies aren’t noisy, the developers always do things “the right way”, and the tests run in the same sequence every time.
The “real problems” appear once your product gets out into the field, whether that’s beta testing or shipping products to customers. Conditions vary widely from one scenario to the next, and customers use your product in ways that you could not anticipate. On top of that, most of your customers won’t report issues to you. If they do report them, you will rarely receive sufficiently helpful descriptions about the error condition and the steps that lead up to it.
One approach is to try and reproduce the issue yourself. This is a guessing game, and if environmental conditions are a factor, you might not even be able to reproduce it. Without reproducing the issue locally, there’s no way to attach your debugger and dig into the cause. This leads to the typical complaint about reporting issues to developers: they simply respond with “cannot reproduce” or “works fine here!”
The best way to prevent this horrible cycle is to automatically capture debug information whenever a fault condition (or other serious error) occurs. This way you can generate the exact information you need without the customer’s input.
Concern 3: Debugging Issues Remotely
Of course, the problem is that your automatically captured debug information is still on your customer’s device. You need some way to get it off of the device and into your hands.
- Your device might automatically transmit that information to your company’s servers using a suitable network connection
- A phone app may automatically collect that information the next time it connects to the device
- A computer tool might be provided to collect the information over USB
Other remote debugging scenarios, such as your manufacturing line, may give you better technical support than a customer could. This allows you to collect any automatically generated debug information, while also making units available for remote debugging (e.g., using a gdb server). One real-world example is the “panic stations” we used while I was working at Apple. If a device encountered a fault or panic on the production line, the CM team could plug the device into a panic station, which would allow us to remotely connect to the device for debugging. Of course, connecting to devices halfway around the world has its own challenges…
Concern 4: Required Expertise
Fault debugging is an intimidating and complex topic that requires you to understand how your processor and language ABI work. Ultimately, YOU (or a small number of capable individuals) get stuck with debugging all of the difficult processor faults that occur. There’s nothing wrong with helping the team, but it certainly makes the critical debugging members a bottleneck for resolving issues. Instead, we would prefer an approach that would enable anyone on the team to confidently resolve the issue.
How The Pros Do It
So now that we’ve outlined the major concerns with a manual debugging approach, I want to give you a high-level overview of how I have seen these problems solved on various teams throughout my career.
Unfortunately, I have to be vague in my descriptions below. While I would love to provide example source code, every solution I’ve helped build has been proprietary. That isn’t a hindrance, however, since the goal of this series is to identify a solution that allows developers avoid re-implementing the capabilities defined below.
The automated fault debugging strategies I’ve encountered in the past generally evolved in five distinct stages:
- Generating a lightweight coredump in software
- Post-processing the coredump
- Saving the coredump
- Collecting the coredump
- Associating the fault with an issue
Stage 1: Generating a Lightweight Coredump in Software
The typical first step in automating the fault debugging process is to automatically gather, parse, and display the output that you would normally collect during your debugging process. Even if you don’t automate the rest of the process, this step in itself represents a massive leap forward, since you no longer need to manually hunt down and decode register values. Instead of having our fault handler(s) implemented as a while(1) loop, we have the fault handler call a coredump collection routine that will decode the bits in the fault status register to tell us what kind of fault occurred. We can also:
- Decode the fault status register bits to provide human-readable output describing the nature of the fault, as well as any associated addresses
- Print out information regarding the processor state, such as:
- Register values
- The stack pointer
- Contents of the stack
- Attempt to generate a backtrace using the
lrvalues that are stored on the stack (if they are valid) - Print the thread state for each thread in our system
- Print the contents of the log buffer
- Print the values of key variables
Over time, the type of data collected tends to evolve based on the continual conflict between a) information we wish we had for debugging purposes and b) the amount of memory we have to store debug information when a crash occurs. For products that communicate over slow or expensive data links (such as cellular connections or Iridium satellites), we also have to factor in the bandwidth that we can allocate to crash information, since this is sometimes slow and/or expensive to transfer. While these limitations mean that our coredumps will fall short of a full gdb-style coredump, we can still collect a significant amount of information to aid our debugging efforts.
Note: Looking for some example implementations showing this approach? See the Further Reading section.
Stage 2: Post-Processing the Coredump
One problem is that we are only able to print raw addresses and hex values for various register values and stack contents. As developers, we primarily want to know about function names, variable names, offsets, and line numbers. There are ways to recover some of this information from within a program instead of printing raw values, but embedded programs often do not have equivalent implementations or leave them out to reduce the overall program size.
For example, we might end up with output like this:
***** USAGE FAULT *****
Attempted to execute an undefined instruction.
Faulting instruction address: 0x0003dc4c

General purpose registers:
	r0:  0x00008001  r1:  0x20035e78
	r2:  0x0003e8a3 r3:  0x20037168
	r4:  0x00000080 r5:  0x1dd222f1
	r6:  0x00000000 r7:  0x20035e88
	r8:  0x20035ee0 r9:  0x0003e87d
	r10: 0x20036820  r11: 0x200366f8
	r12/ip:  0xa0000000
	r13/sp: 0x20035e78
	r14/lr:  0x0003dc4d
	r15/pc: 0x0003dc4c
	xpsr:  0x61040000
	fpscr:  0x00000000

Stack state:
	psp:  0x20035e10
	stack[ 0]:  0x00000001
	stack[ 1]:  0x00000001
	stack[ 2]:  0x00000001
	stack[ 3]:  0x00000001
	[... more stack information]

Thread 0 Backtrace:
	[.... backtrace information]

Thread 1 Backtrace:
	 [.... backtrace information]
Odds are good that you can’t see anything meaningful in those addresses. You would probably rather see the addresses replaced with symbol names and offsets whenever possible, like this:
***** USAGE FAULT *****
Attempt to execute undefined instruction
Faulting instruction address: prv_fault_handling_assert+20 (0x0003dc4c)

General purpose registers:
	[... truncated]
	r13/sp: z_main_stack+8088 (0x20035e78)
	r14/lr:  0x0003dc4d
	r15/pc: prv_fault_handling_assert+20 (0x0003dc4c)
Following Apple’s lead, I typically call this conversion process “symbolicating”. Generally, this conversion happens using a support script. The script will take in two inputs:
- Your captured coredump (for now, likely just copied out of the terminal)
- A file that can be used to match addresses with symbol names, such as a
.mapfile, a.lstfile, or an.elffile with debug symbols included
The script goes through each address it finds in the coredump file and replaces any that correspond to a valid symbol with the appropriate name and offset. If you are using an .elf file, you can also recover line number information if present in the image. Other programs can also be used for this purpose, such as addr2line or atos.
If you are working in C++, you will also want to run your file through c++filt (or an equivalent “demangling” program), which will convert your “mangled” C++ symbol names (e.g., _Z1foov) back into a readable form (foo()).
Stage 3: Saving the Coredump
Typically, teams start by printing the coredump information out to the serial terminal (or other communication endpoint). This approach often suffices during the initial development period, when developers are the primary people working with these devices. Any errors that occur tend to happen while the engineer is working, and they are able to see the coredump and begin debugging. Post-processing at this stage occurs by copying the debug output into a text file and running it through a script.
Later in the product development cycle, this approach becomes insufficient. Devices start making their way into the hands of users, whether that is internal team members testing the device, beta testers, or customers who have purchased the product. If a fault occurs, developers won’t be around to capture the debug text. The only way to debug problems observed in the field is to reproduce them in the office. Unless, of course, we can save our coredump information so that it can be extracted from the device at a later point in time.
The tricky aspect of this stage is figuring out exactly where and how much of the coredump will be stored. Example questions to answer include:
- Can you allocate space in RAM, allowing you to write the coredump to memory before rebooting the device?
- Is there space in flash memory to store coredumps so that they persist even if the device loses power?
- What information does the development team require for debugging faults, and what is simply nice-to-have?
- Is it better to store a single full coredump, or reduce the space in order to account for the possibility that multiple faults may occur before a single coredump can be retrieved?
- Can you store a minimal set of information if multiple faults occur while you already have a coredump in memory, ensuring you can tell that those crashes occurred, even if the information is limited?
- How can we compress or encode the coredump information to reduce its overall size (e.g., run-length encoding, lz4 compression)?
- What communication channel will we use to retrieve saved coredump information, and what constraints does that place on how we store coredumps?
- See the next section for further discussion on this point.
No matter your circumstances, you’re never going to be able to save as much information as you can print to the console or access with debugging hardware. This means that reproducing faults at your desk may still be necessary to completely resolve the issue. However, having limited information about crashes that occur in the field is much better than having no information about them.
Stage 4: Collecting the Coredump
Once you’re able to save coredumps, you need some way to get them off of the device and into the hands of your development team. How this happens is extremely dependent on the product’s communication channels and the team’s supporting infrastructure. The collection process may even evolve throughout the product development lifecycle, starting with a simple implementation (e.g., manually collecting coredumps over a serial connection using a CLI) and gradually becoming more complex (e.g., having an iOS application check for coredumps when connecting to the device, retrieve them, and send them to a server for post-processing).
These are some of the different approaches I have seen throughout my career:
- Using a program that can retrieve coredump information over USB when a device is plugged in
- Connecting to the device using a debug shell interface that provides a command for sending coredump information to the development machine
- Having high-powered gateways in a distributed network collect coredumps from low-powered nodes whenever they check in
- Having the associated phone application retrieve coredumps over BLE whenever it connects to the device and using the phone’s internet connection is used to upload coredumps to the development server
- Using a provisioned Wi-Fi connection to automatically upload coredump files
- Using a cellular or satellite radio connection to automatically upload coredump files
The chosen collection method and communication channel will likely have an effect on the amount of information you can store. For example, satellite radios and cellular connections often necessitate much smaller coredumps than a Wi-Fi connection. Availability of the connection may also impact your strategy. Devices with a (semi-)persistent connection, such as Wi-Fi or cellular, may be able to store a single coredump in RAM because it can be uploaded immediately upon rebooting the device. Devices with inconsistent connectivity likely need to store coredumps in flash so they are available when the next connection attempt occurs.
Stage 5: Associating the Fault with an Issue
Collecting this crash data is pointless if we aren’t using it. We need to update our issue tracking system of choice with the coredumps and fault information we have collected from the field. We also need to filter new coredumps to determine whether they are brand new or map to an existing issue. Ideally, existing issues are updated with occurrence rates and version information based on incoming coredumps.
Triaging crash reports and coredumps can quickly become challenging, especially if we have a large number of devices in the field and/or numerous conditions that trigger faults, crashes, or assertions. It can also quickly become overwhelming if a given error has a high probability of occurring.
Sometimes one individual is given the responsibility of manually reviewing each coredump to determine whether the report is new or a duplicate of an existing issue. Often, this inglorious activity gets pawned off onto project managers or interns. Depending on the specific issue, they may or may not have the technical expertise to effectively determine what is a duplicate and what is not. On other teams ensured that everyone on the development team shared the load by setting up a regular “triage” rotation. In any case, this boring and tedious job is often considered to be a low priority, and it’s easy to drop when the team gets backed up.
With enough devices, the problem eventually grows out of control regardless of the team’s dedication. At this point, we need to automate the process of filing issues and identifying duplicate reports among the incoming logs. This work can be extremely beneficial, but it also requires you to allocate development resources to this specific task. Small teams may not have the luxury of dedicating a developer to work on internal tooling like this. Additionally, the triaging and de-duplicating work is highly specific to the team’s issue tracking system and coredump information. False positives and false negatives can be a headache depending on the chosen strategy: different faults may have similar signatures, the same fault may occur with different backtraces or log buffer contents, and the same fault may have different addresses and line numbers in different builds. Fully automated triaging and de-duplication may not even be possible with some issue tracking systems, and instead must occur on the raw coredump files before they are filed as issues.
Finding a Solution
The fault debugging and coredump processes I described above are not just vague descriptions that I made up. These are actual capabilities that I’ve implemented, used, or encountered on various projects throughout my career. While the exact implementations and overall processes differed from one company to the next, the process described above extracts the common steps out of these varied implementations.
While those processes certainly take our debugging capabilities to a new level, they are time-consuming to implement and require that you dedicate development resources to the task. Many companies may not make this tradeoff because they think that their limited resources are better spent working on new features rather than improving the debug-ability of their systems.
Because this type of support requires such a significant internal investment, many companies keep this type of tooling private rather than releasing it as open source software. Providing equivalent functionality at a new company means you need to start from scratch and put in the same level of investment. Some RTOSes, such as Zephyr and mBed, help the process by processing and printing the fault information for us, but that’s only one piece of the puzzle: you still have to handle coredump storage, collection, and post-processing.
This continual re-engineering effort represents significant money and time-to-market waste in our industry, especially in today’s increasingly competitive and agile landscape. This is why I am so interested in reusable and portable embedded software, identifying high-quality libraires, and building up my own reusable embedded systems infrastructure. You can gain significant advantage over your competition by relying on suitable off-the-shelf solutions and reusable components in your software.
This idea of “wasted re-development” is especially true for software components that fall into the “infrastructure” category. These components do not directly relate to the features you want to provide to your customers. They are rarely visible, which means you cannot use them to differentiate your product from the competitors’. Instead, they serve to make things work behind the scenes or help your developers operate more effectively.
Since the advent of AWS and its competitors, I doubt that many of your companies are still running their own servers; it’s simply much cheaper, more reliable, and much less of a headache to outsource this infrastructure work to other companies who maintain these systems for you. My question is: why do we treat our embedded systems software infrastructure any differently?
My goal is to find a suitable solution to this common infrastructure requirement. Stay tuned to see what I dig up. My hope is that you won’t need to reinvent this particular wheel on future projects, allowing you to have more time to focus on your product’s features and unique value proposition.
Further Reading
For example implementations of on-device fault analysis, see:
- Chris’s Walkthrough in “How to Debug a HardFault on an ARM Cortex-M MCU
- Segger’s embOS Fault Handler
- Zephyr’s Fault Handler
- ARM mbed Fault Handler
For general information on debugging faults:
- Interrupt: How to Debug a HardFault on an ARM Cortex-M MCU
- Interrupt: A Guide to Watchdog Timers for Embedded Systems
- Segger: Analyzing HardFaults on Cortex-M CPU
- Segger Wiki: Cortex-M Fault – contains example fault analysis code and examples of different situations that cause faults.
- Segger: Fault Analysis with Ozone
- StackOverflow: How to automatically generate a stacktrace when my program crashes
- ScienceDirect: Fault Exception
- ARM Cortex-M7 Processor Technical Reference Manual: Register Summary
- ARM: Using Cortex-M3/M4/M7 Fault Exceptions
- CMSIS Default Fault Handler Implementation
Thank you for a great article! I got a few new ideas to take with me from this article.
(Some of the links to different chapter in the article are dead. They seem to point to a file on your local desktop 🙂 )
Thanks for the feedback! I’ve fixed the links.